

Enable Contextual SQL Log September 19, 2024
MySQL can be set up to store a more extensive and detailed history of queries. Numerous tools are available for capturing and assessing the complexity and performance of queries. When developing a web application, it can be beneficial to link the application code with the database queries. Gyroscope applications utilize the "cmd" switch to manage server-side requests, enabling efficient profiling of live SQL queries while maintaining the "cmd context."
Steps to enable contextual SQL profiler
In connect.php:
$enable_db_profiler=1;
$db_profiler='/dev/shm/pizza.log';
The log file name should match the database name. For instance, in the example provided, the database for the project is named "pizza".
Keep the profiling flag enabled solely during the testing phase.
With the "dbadmin" access, a Gyroscope user has the ability to view the query summary.
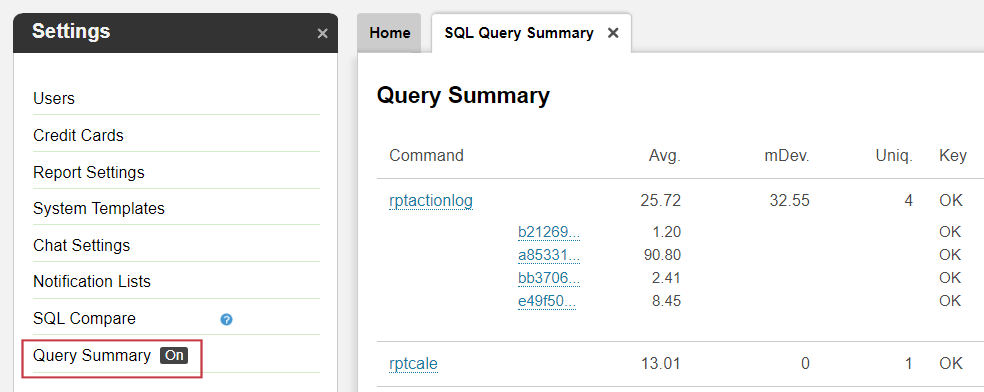
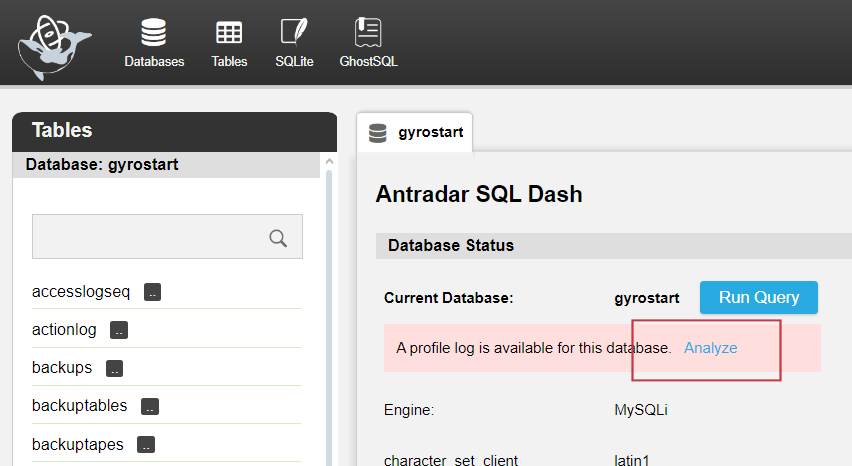
SQLDash can also identify the log file that is generated. It calculates the average query cost for each "cmd", enabling the swift identification of queries that are expensive in terms of structure.
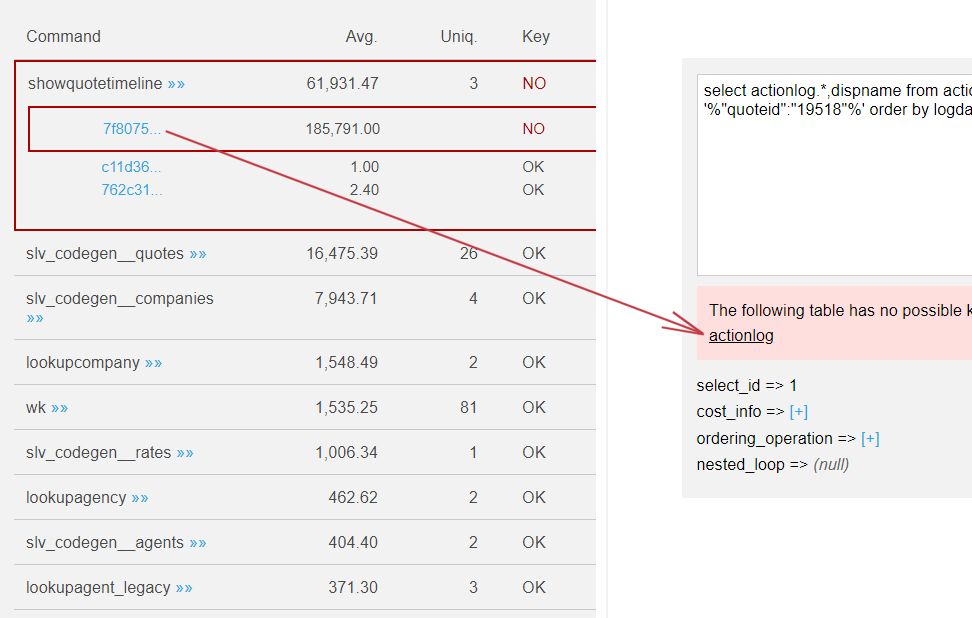
If a particular query is unable to locate a relevant index to link the tables, it is typically due to the absence of indexes in the table. In such cases, both the specific query and the "cmd" group to which it belongs will be highlighted with a red outline. Users can delve deeper into any query for additional analysis. SQLDash's version of the analyzer will also directly connect the problematic table to the table schema view.
Additional migration steps
Previous versions of Gyroscope require additional patching.
Add to the end of connect.php:
$enable_db_profiler=1; //persistent db query dumper
$db_profiler='/dev/shm/pizza.log';
if (isset($enable_db_profiler)&&$enable_db_profiler){
$f_dblog=fopen($db_profiler,'a');
function gsconnect_exit(){
global $f_dblog;
if (isset($f_dblog)&&$f_dblog) {fclose($f_dblog);}
}
register_shutdown_function('gsconnect_exit');
}//profiler
Then, in sql.php, add this function:
function sql_profile_dump($query,$params=null){
global $f_dblog;
$cmd=$_GET['cmd']??'';
if (!isset($f_dblog)) return;
if ($cmd=='') return;
fwrite($f_dblog,
json_encode(array(
'cmd'=>$cmd,
'query'=>$query,
'params'=>$params))."\r\n"
);
}
And patch sql_prep:
function sql_prep(...
global $enable_db_profiler;
...
if (isset($enable_db_profiler)&&$enable_db_profiler){
sql_profile_dump($query,$params);
}
}
Similarly, patch sql_query:
function sql_query(...
global $enable_db_profiler;
...
if (isset($enable_db_profiler)&&$enable_db_profiler){
sql_profile_dump($query);
}
}
Logging for API
If the app offers an API endpoint and the service selector is "action", mimic a "cmd" like the following:
$_GET['cmd']='api_'.$action;
Finally, a cron job can be configured to clear each log every 6 hours:
0 */6 * * * > /dev/shm/pizza.log